5.9.1 Descriptive statistics for paneldata
In advance of paneldata regression analysis, we recommend to map out your paneldata through various descriptive tools that are tailor made to such data:
-
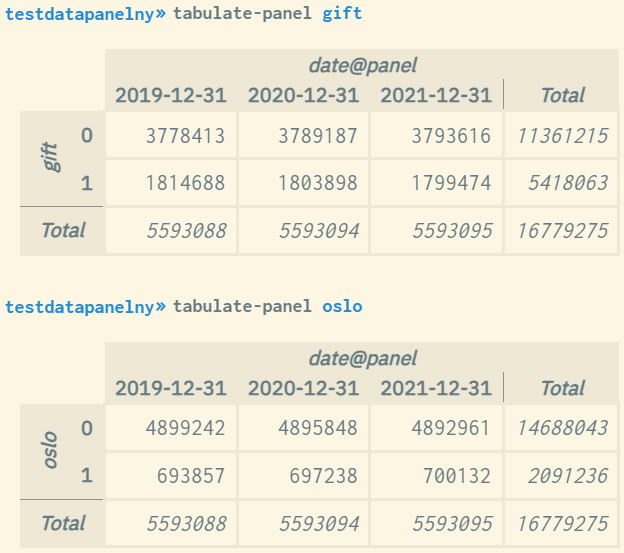
tabulate-panelcorresponds to the commandtabulateused for regular datasets, cf. section 4.1, but shows instead values for all measurement dates. Liketabulate, percentage options can be used. If multiple variables are specified, multi-dimensional cross tables are displayed for the relevant variables -
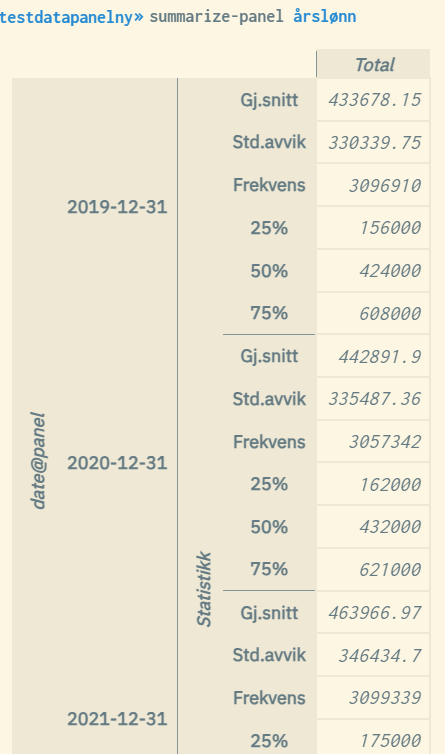
summarize-panelcorresponds to the commandsummarizeused for regular datasets, cf. section 4.2, but shows instead values for all measurement dates. Values are displayed vertically and not horizontally, and the mouse cursor need to be held over the respective values to show their meaning -
transitions-panelshows a two-way matrix containing frequencies/probabilities of transitions between all combinations of categorical values over time (transition probabilities), for a given variable. The leading column represents the base values, while the table header represents the transition values. If multiple variables are specified, two-way transition tables are displayed for each variable. Transitions are by default represented by frequencies and percentages (row percentage). Transitions either from or to missing values (sysmiss) are kept out of the tabulation.
Example 1: Tabulate-panel for "married" and "Oslo"
Example 2: Summarize-panel for the dependent variable "yearly salary" (same dataset)
Example 3: Transitions-panel (transition rates for combinations of categorical values) for the variables "married" and "Oslo" respectively (same dataset)
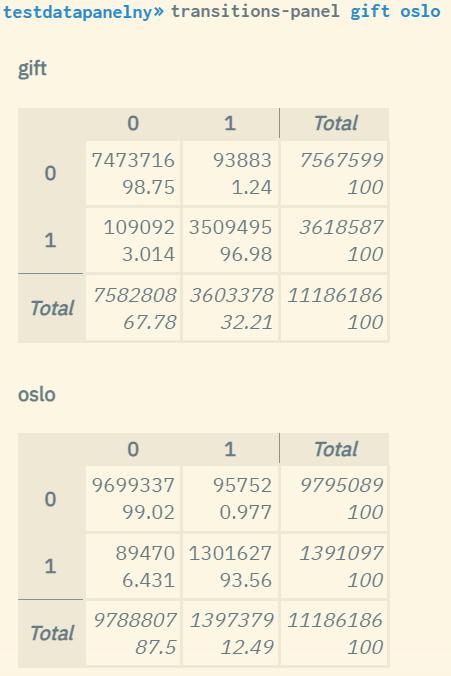
Comment on table in example 3:
In 99% of the cases, persons not resident in Oslo will have the same condition the following year (next measurement). The rest, 1%, will move to Oslo. Among those in the population who live in Oslo at a given time, 6.4% will move out of Oslo while 93.6% will remain the following year (next measurement).
The same principle applies to the variable "gift" (married): Here we see that 1.2% changes the status from non-married to married from one year to another (next measurement) over the total measurement period. 3% changes status from married to non-married.